Get to know your fraud0 Dashboard
This section will help you understand the reporting data and what it means. We also want to give you an idea of how you can interact with this reporting data.
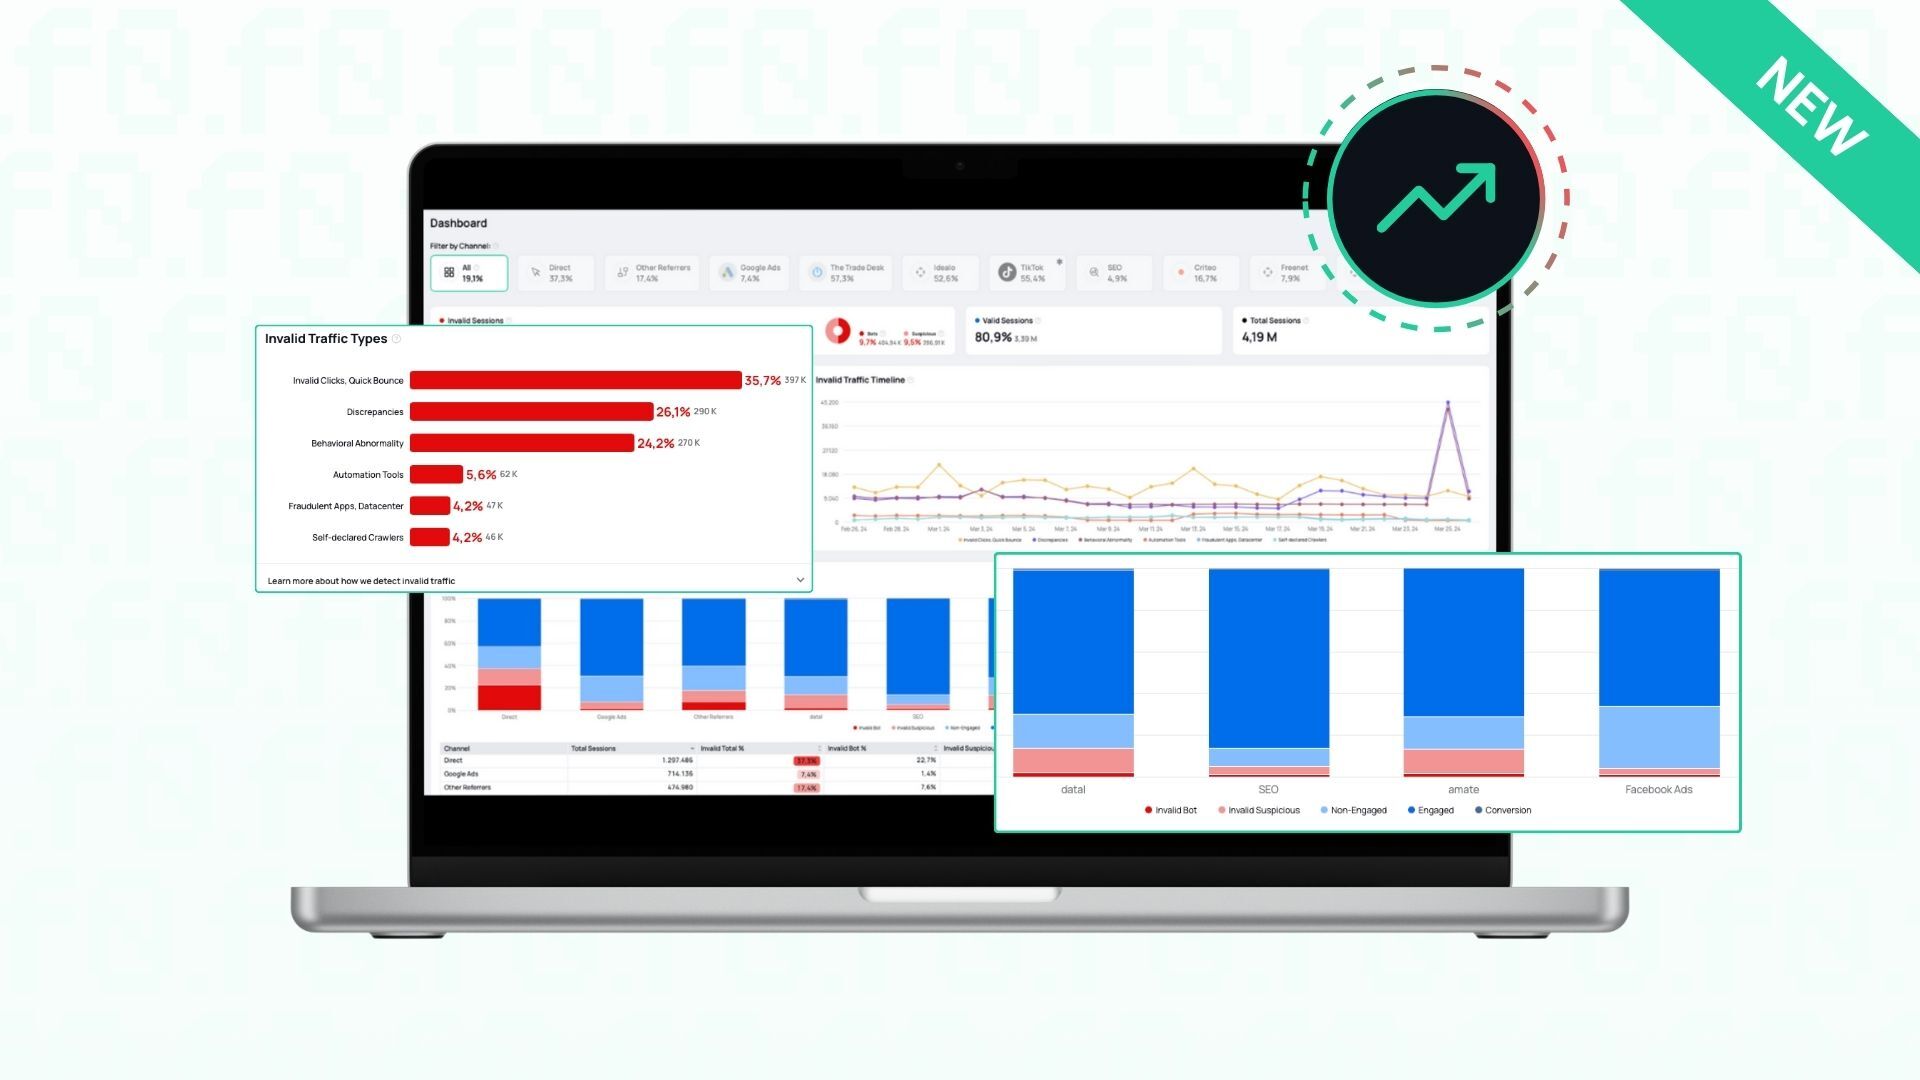
First of all, let’s review how we detect invalid traffic and how we distinguish between different traffic types.
Learn more about how we detect invalid traffic:
To detect invalid traffic, we employ advanced algorithms and machine learning to analyze data discrepancies, behavioral anomalies, and traffic patterns. For more details, see our Help Center FAQs.
Learn more about how we distinguish between different traffic types across marketing channels:
To differentiate traffic by validity and engagement, we employ advanced analytics and behavioral analysis, including:
Validity assessment: Identifying valid vs. invalid traffic (e.g., bots) using IP analysis, user agent examination, and behavior patterns.
Engagement evaluation: Analyzing interactions with your content through metrics like session duration and page views, distinguishing natural user patterns from uniform bot activity.
Visualization fraud0 Dashboard - Status March 2024
Documentation for reporting data
The following data is available in the fraud0 on-site traffic reports. All of these fields are available on a session basis. Each field can be used for filtering, therefore restricting the traffic to a subset of the total data. These fields can also be used as a dimension, enabling a comparison between different traffic subsets.
Tracking Data
Channel: predefined queries for commonly used marketing channels.
UTM Source, UTM Campaign, UTM Content, UTM Medium, UTM Term: These fields represent the UTM query parameters that were passed on the first page visited in a given session.
Referrer: the referrer domain of the first page in the session.
Domain: the domain where the traffic occurred. This is only relevant if you use the same fraud0 tracking code on multiple domains.
Visitor Data
Bot Types: indicates how bot traffic was detected. Note that a session can be associated with multiple bot types, so adding traffic numbers for each bot type will give a result larger than the total bot count.
User agent: indicates the browser used by the visitor, like “Safari” or “Chrome Mobile” for humans. For self-declared bots, this can commonly be the name of the bot, for example “Bytespider” or “Headless Chrome”. Note that some bots pretend to use a regular browser. Some bots also pretend to be another bot in order to avoid being blocked; when this is the case we indicate such traffic, for example “Googlebot (fake)”.
OS: The operating system used by the visitor
Device Type: The type of device used by the visitor. This primarily identifies devices like mobile phones and tablets. Desktop devices and servers cannot be identified separately and are indicated as having the “undefined” device type.
ISP: the name of the company operating the IP address. For typical human visitors this would be the Internet service provider, like Deutsche Telekom or Vodafone. For Datacenter traffic this would be the name of the company operating the datacenter, like Amazon or Hetzner.
Country: the country of the visitor, based on the IP address
Time Data
Date: The day on which the traffic occurred
Hour: The time at which the traffic occurred
Hour aggregated: The time at which the traffic occurred, independently of the day. This makes it possible to identify general daily traffic patterns.
Need support?
Do you still have questions or require further details? Contact our support team for assistance!