
Onsite Analytics
Welcome to our Onsite Product!
Onsite Analytics gives you a clear overview of invalid traffic, mitigation performance, recovery, and traffic quality across your channels. In the fraud0 interface, you can monitor blocked traffic, review refund performance, inspect evidence, and analyze channel-specific reporting in one place. At the end of this article, you’ll find all the links you need to get Onsite setup up and running.
Welcome to your fraud0 Dashboard
»The fraud0 Dashboard provides a high-level overview of your account performance. It combines recovery metrics, mitigation activity, traffic quality KPIs, and channel-level breakdowns so you can quickly assess how fraud0 is protecting your media spend.«
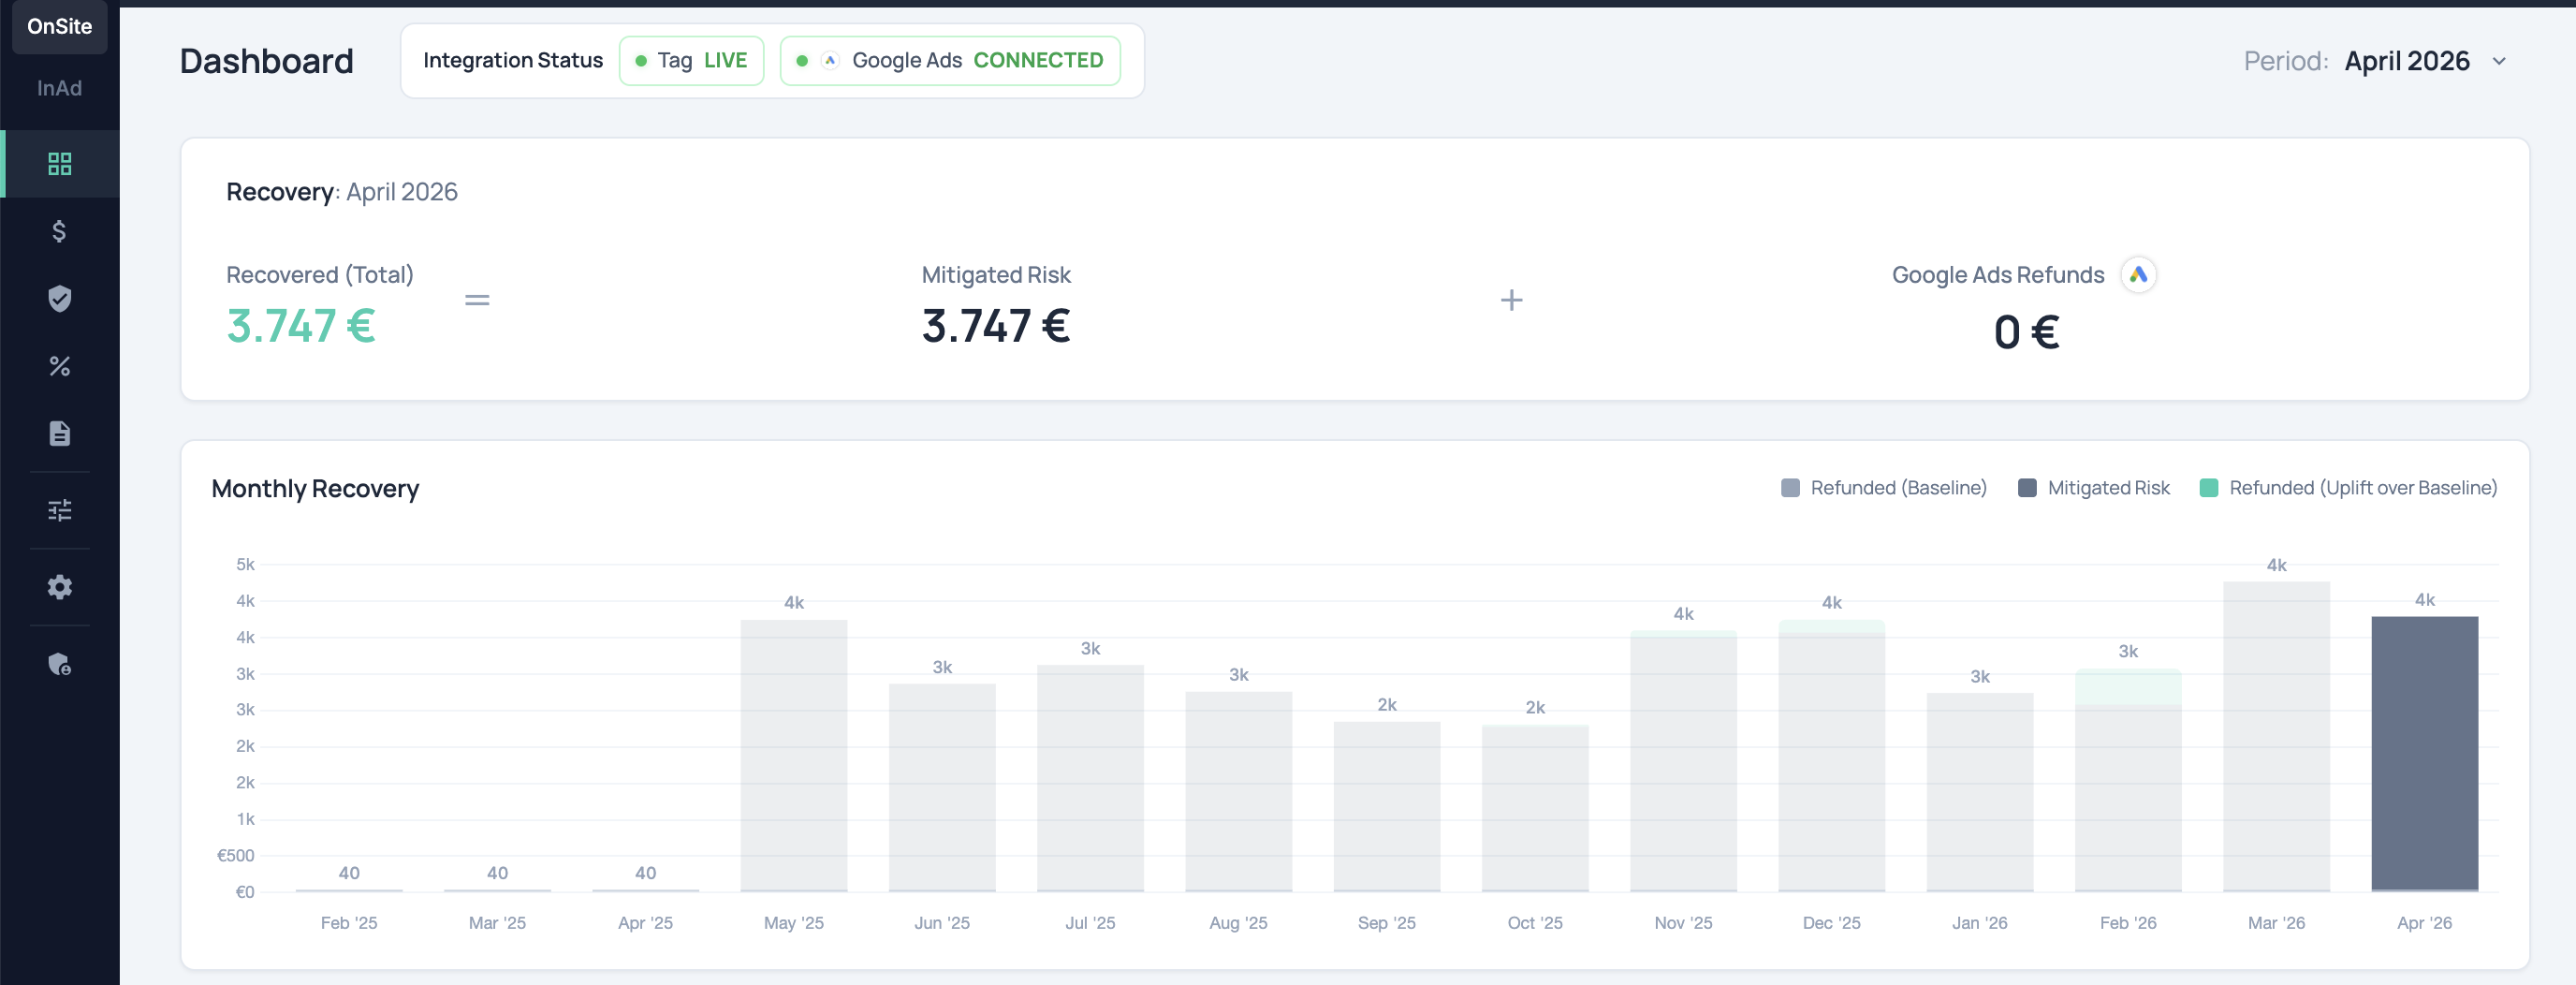
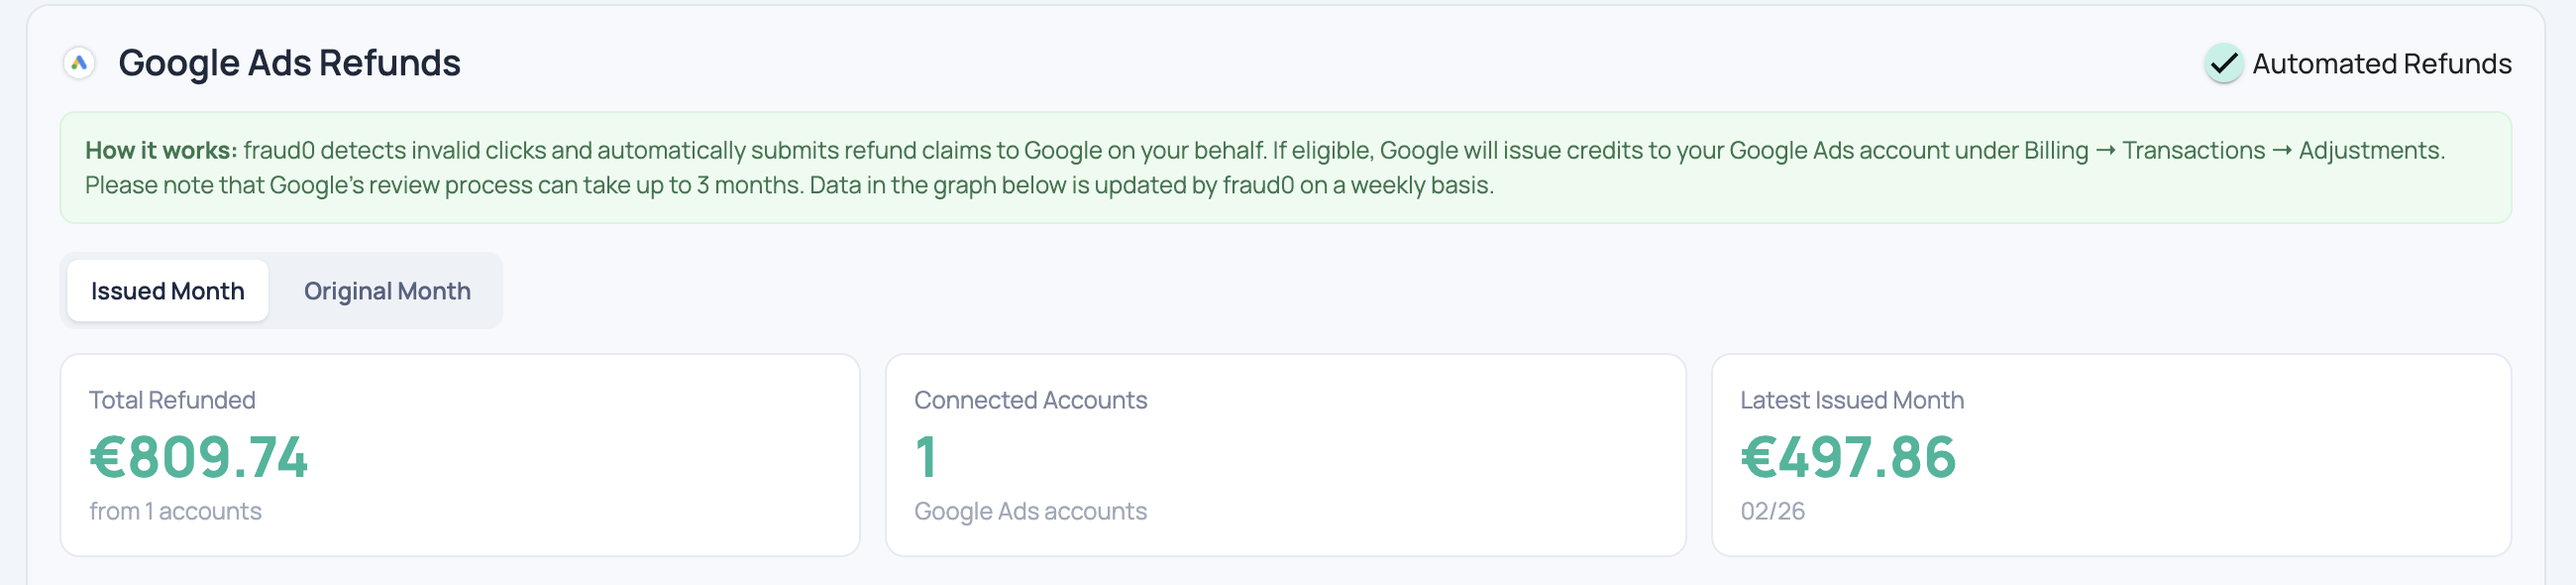
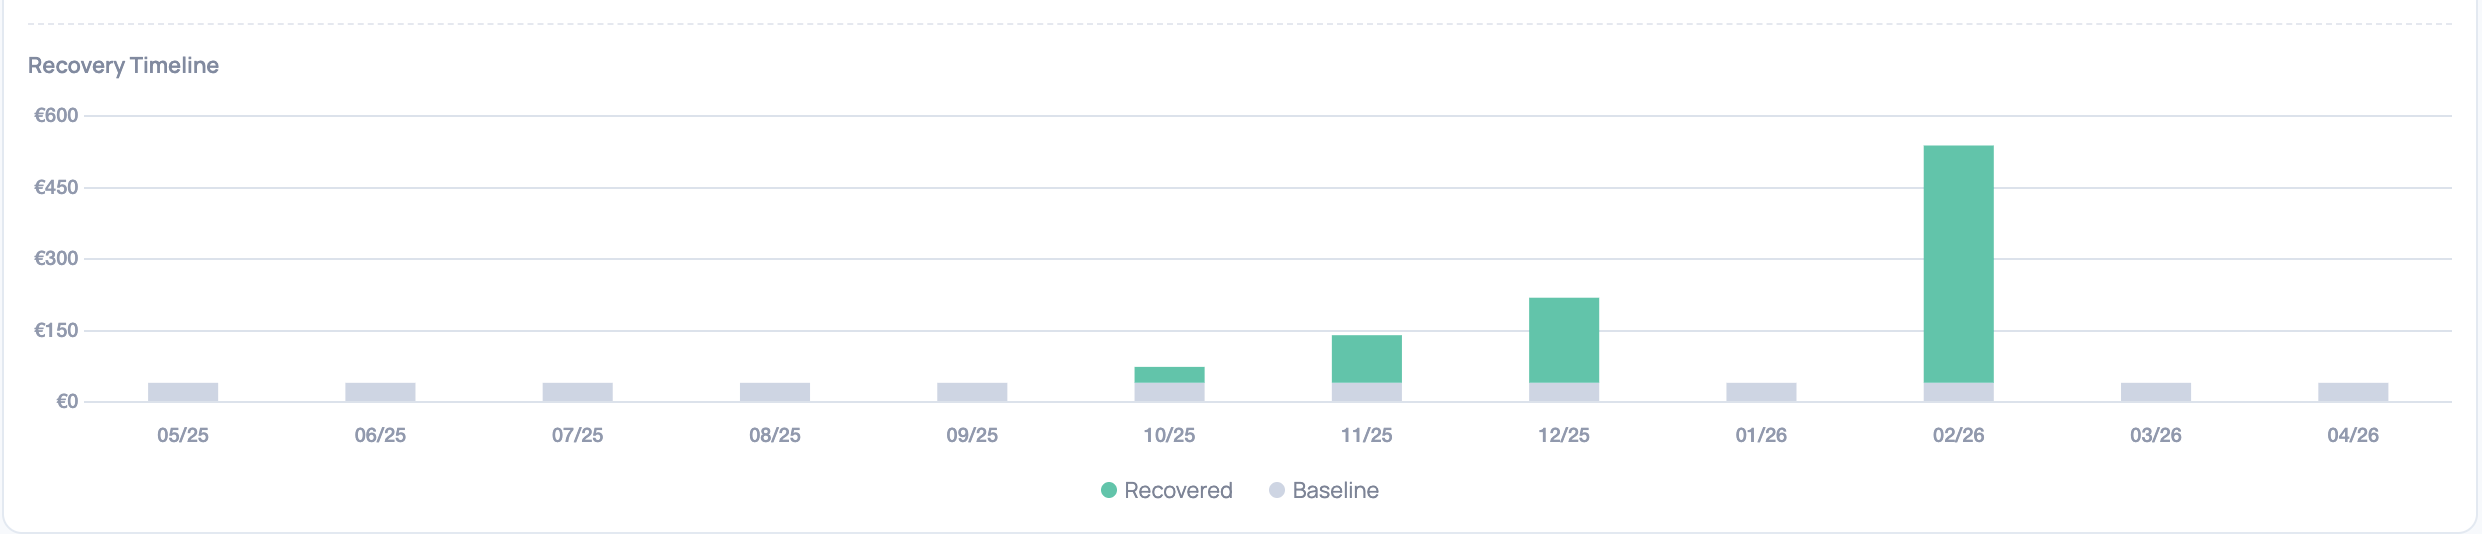
Recovery & Refund Performance
The Recovery section shows how much value fraud0 has recovered or mitigated over time. Users can review total recovered value, mitigated risk, refund performance, and monthly recovery trends directly in the interface.
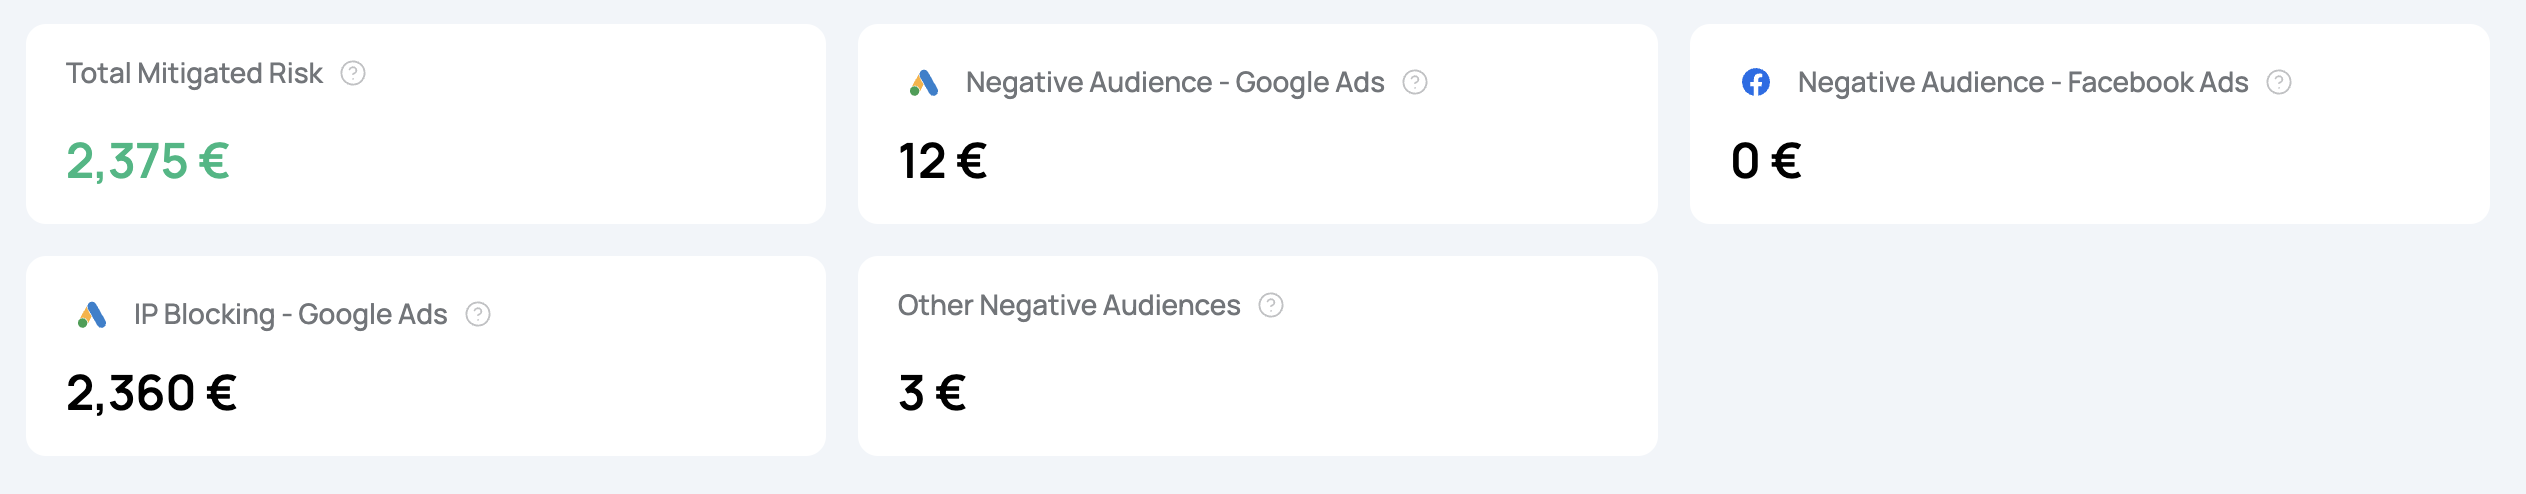
Blocking & Mitigation
The Removal area shows how fraud0 mitigates invalid traffic across channels. Depending on the setup, this includes IP blocking, negative audiences, and other mitigation strategies, along with the estimated mitigated risk.
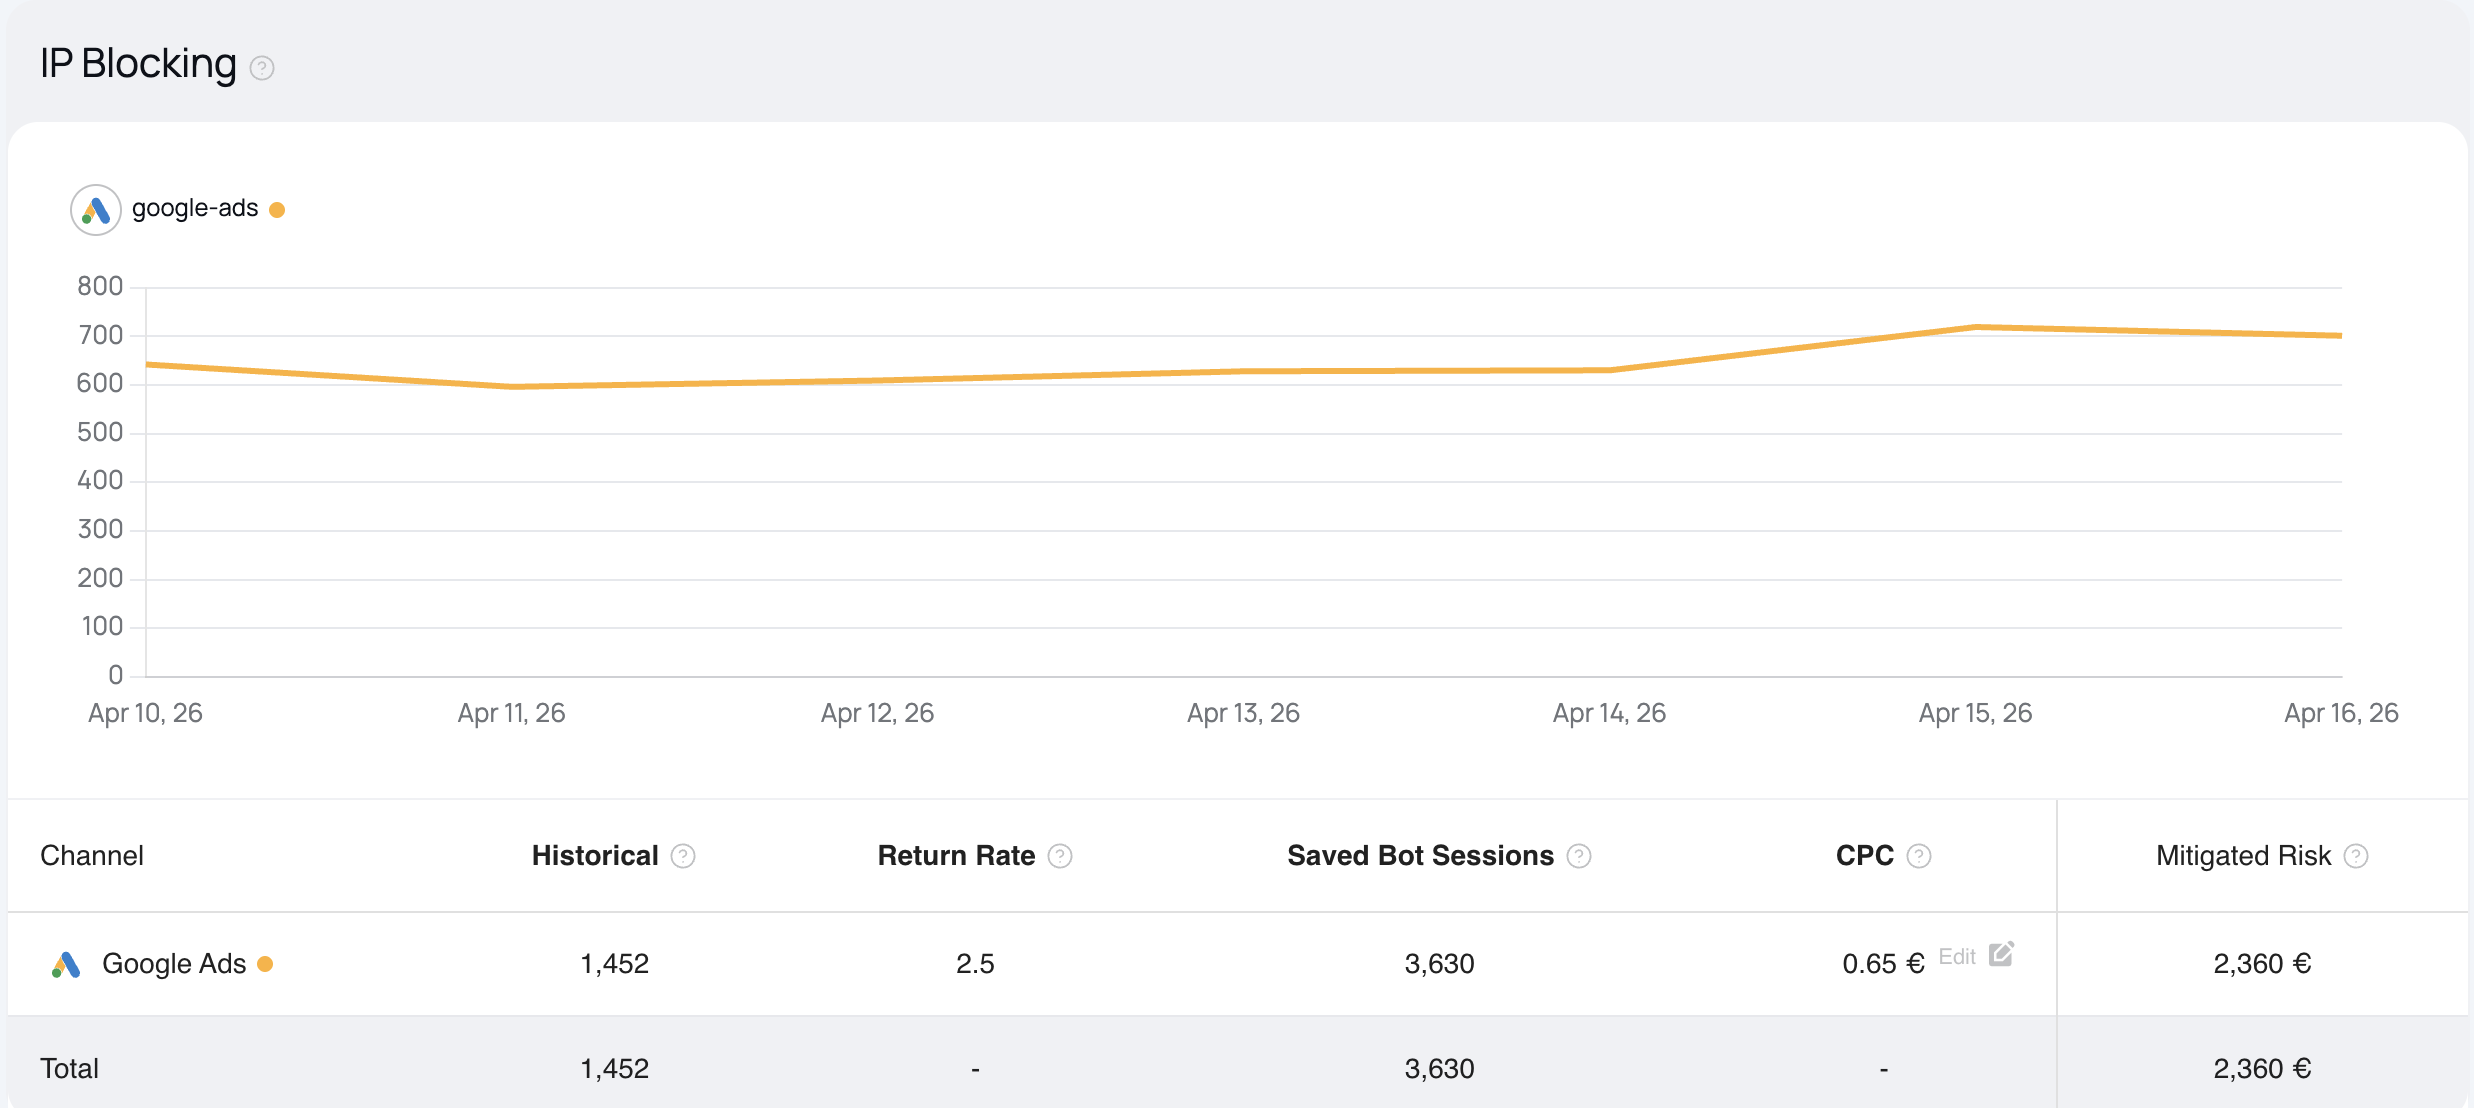
IP Blocking
This component offers detailed insights into IP blocking of bots affecting your Google Ads campaigns. It features a historical chart that tracks patterns of returning bot activity over time. The accompanying table presents estimated cost savings resulting from automated IP blocking performed by the underlying service. These savings are based on statistical analysis and represent approximate budget reallocations achieved by preventing wasted ad spend on bots.
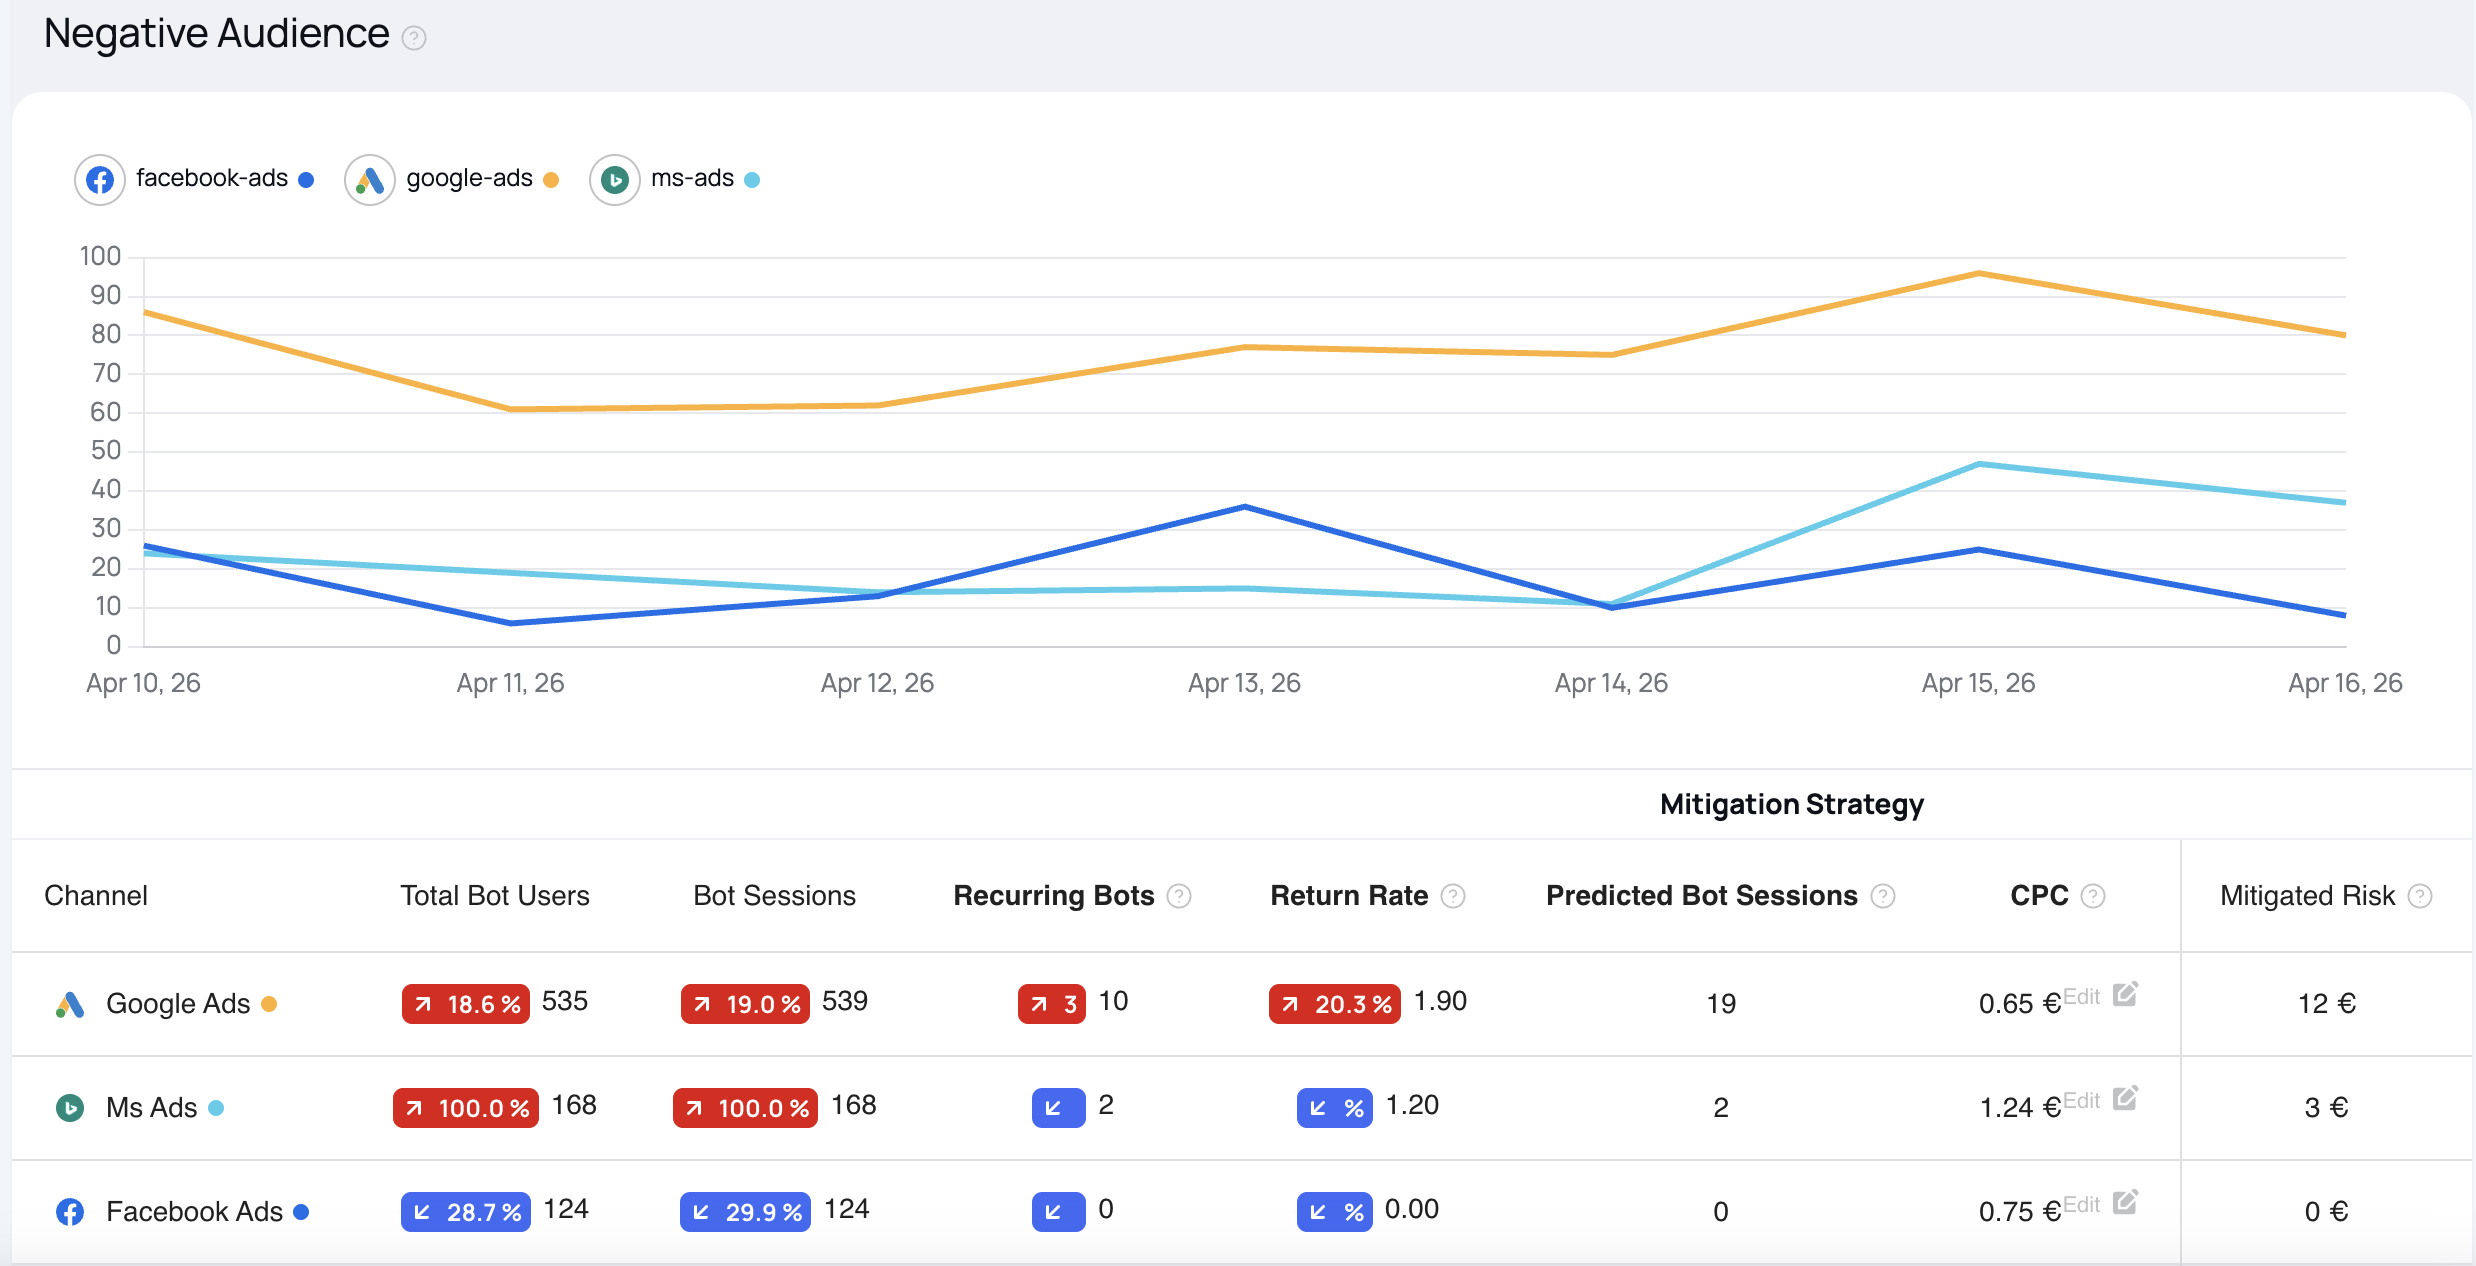
Negative Audience
This visualizes bot-related ad traffic across major advertising platforms. It displays a comparative chart and data table showing estimated Wasted Ad Spend—the budget consumed by bot traffic that evaded detection and filtering mechanisms. A lower Wasted Ad Spend value indicates more effective bot mitigation and better ad performance efficiency.
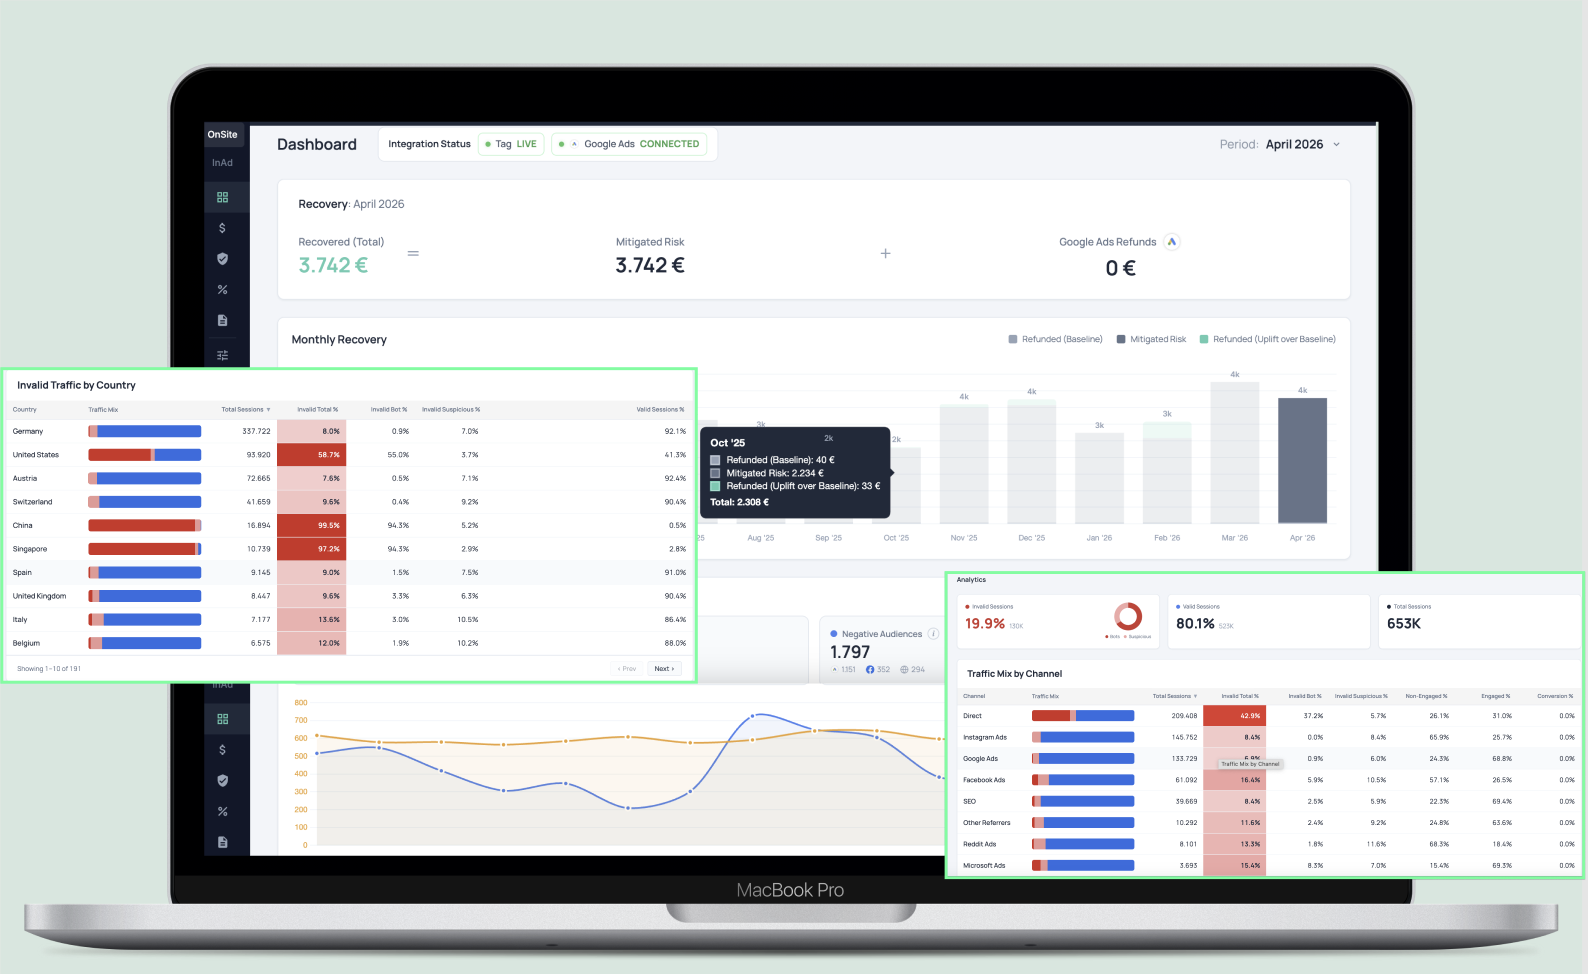
Evidence
In the Evidence section, users can inspect concrete indicators of invalid traffic, including suspicious IP addresses, affected channels, countries, reasons for classification, and repeated invalid sessions.
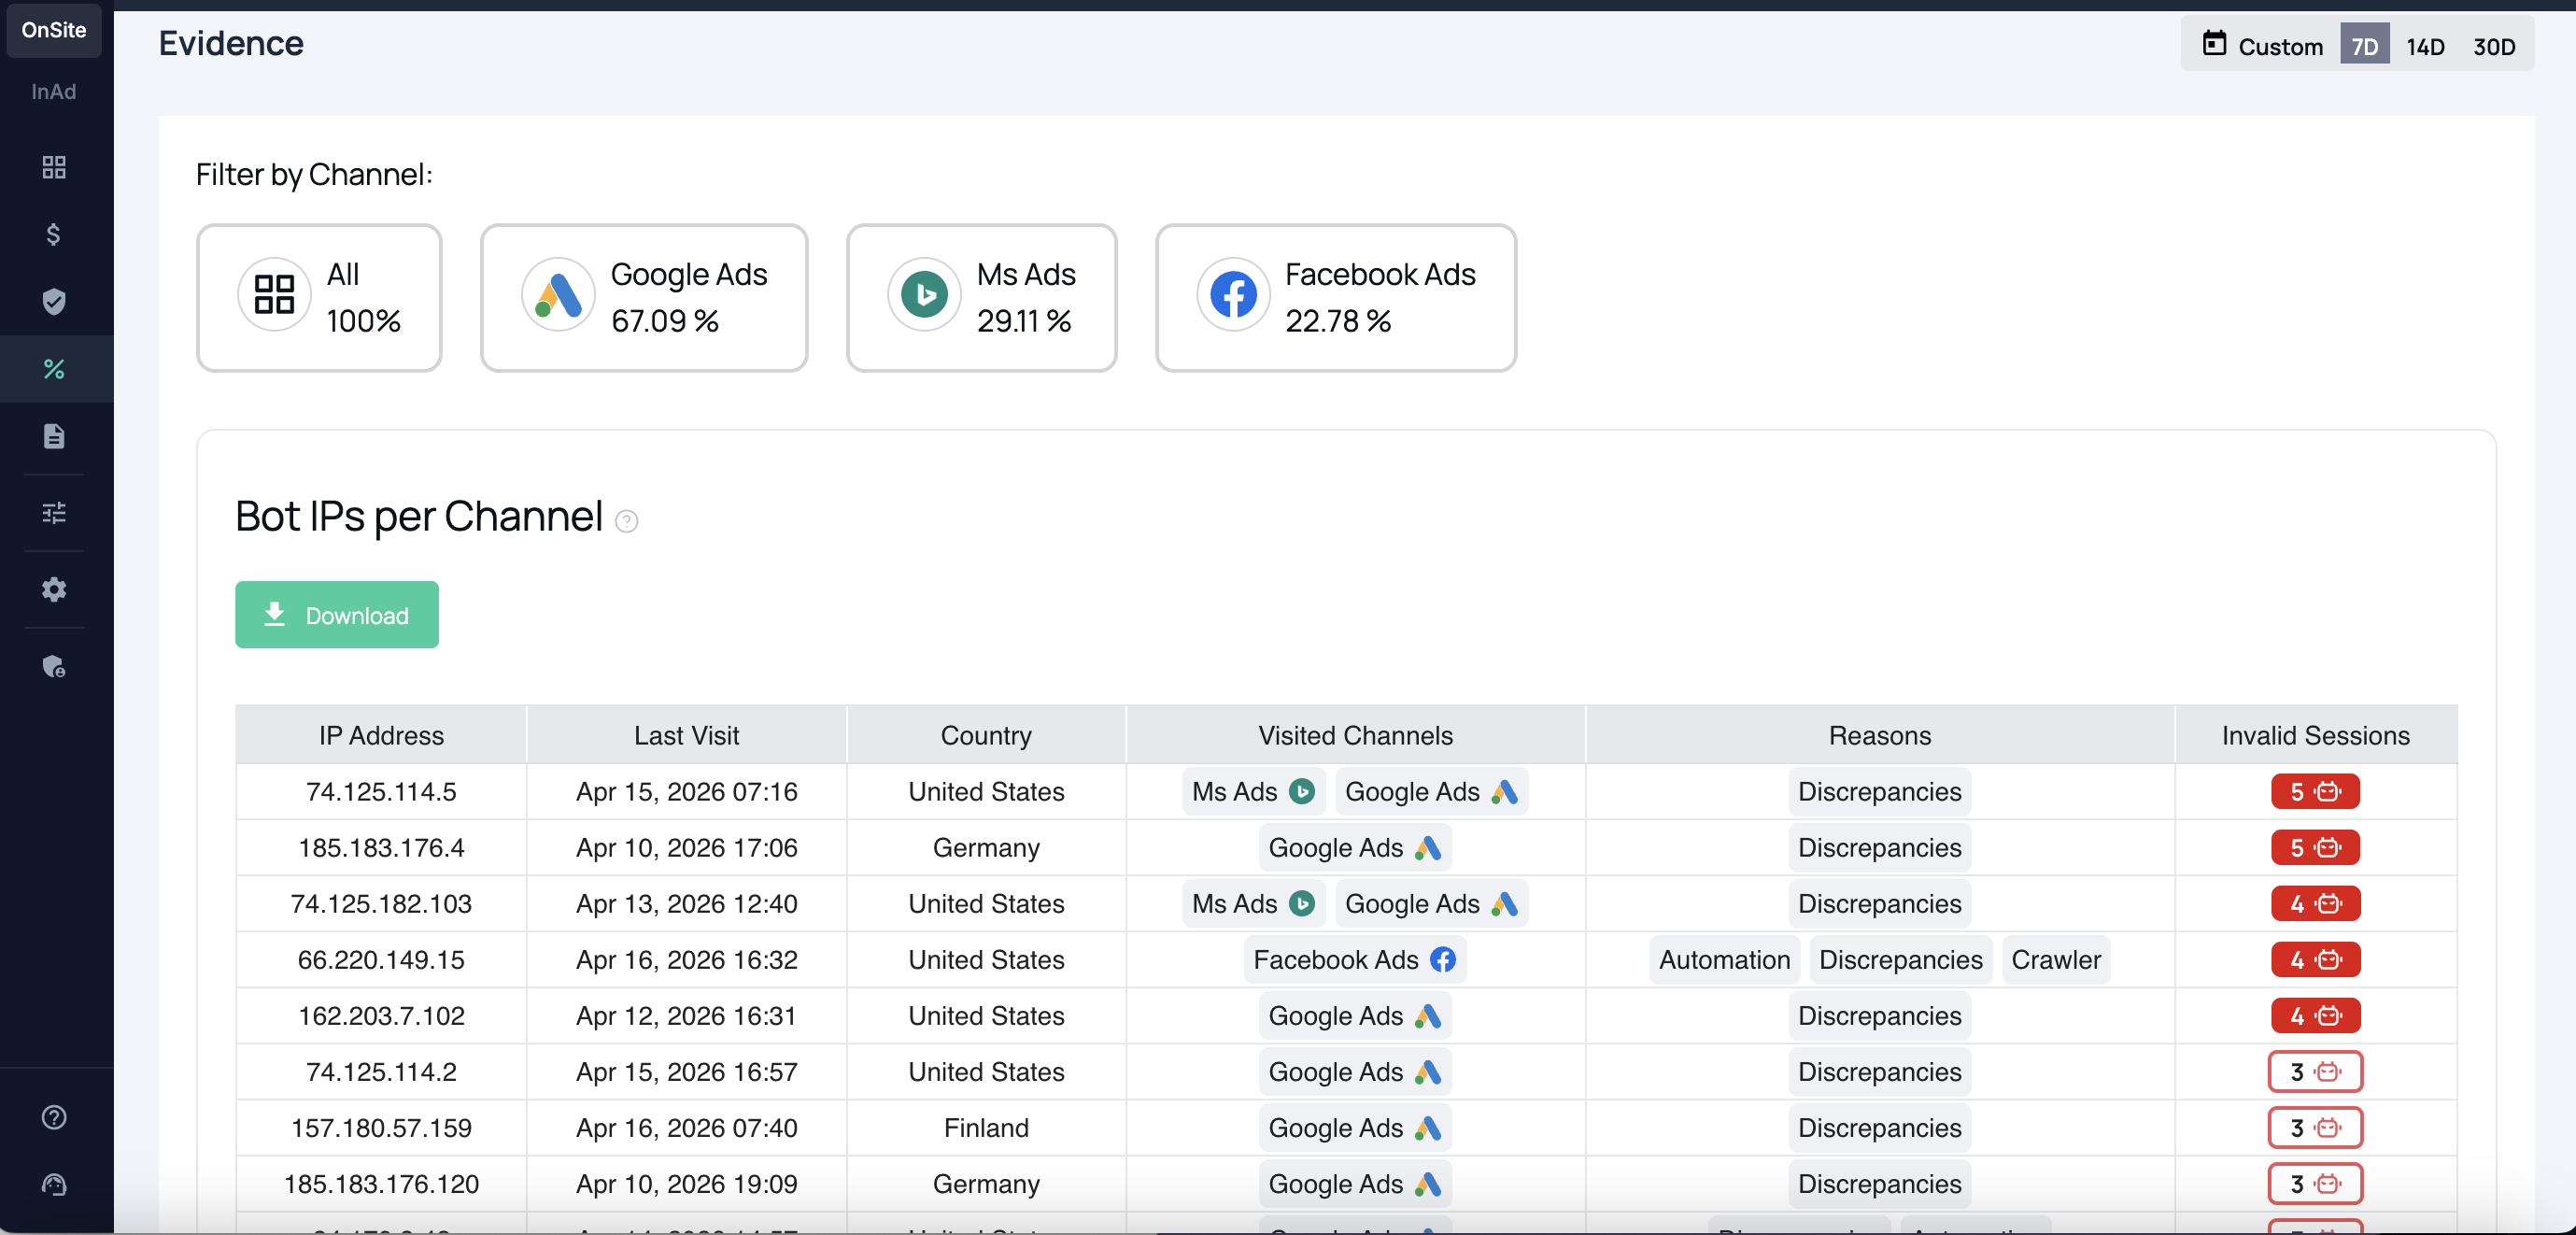
Bot IPs per Channel
Here we provide an overview of all the IP addresses identified as bot traffic within the selected time range. This table enables deeper analysis of malicious traffic and supports more accurate ad traffic filtering and optimization.
Each row includes the following details:
IP Address: The specific IP identified as a source of bot traffic.
Last Visit: The most recent date this IP was active on your tracked channels.
Country: The geographic origin of the IP address.
Visited Channels: Advertising platforms or sources where the bot activity was detected (e.g., Google Ads, Facebook, etc.).
Reasons: The criteria or signals that led to the IP being flagged as a bot (e.g., known bot patterns, behavioral anomalies, high-frequency requests).
Invalid Sessions Count: The number of sessions generated by this IP that were classified as invalid or bot-driven.
Evidence data can help internal teams validate findings, review traffic anomalies, and understand why specific visits were classified as invalid.
Reporting
The Reporting section allows users to analyze traffic quality across predefined report types, compare dimensions such as channels, UTM parameters, countries, or referrers, and export the results as CSV.
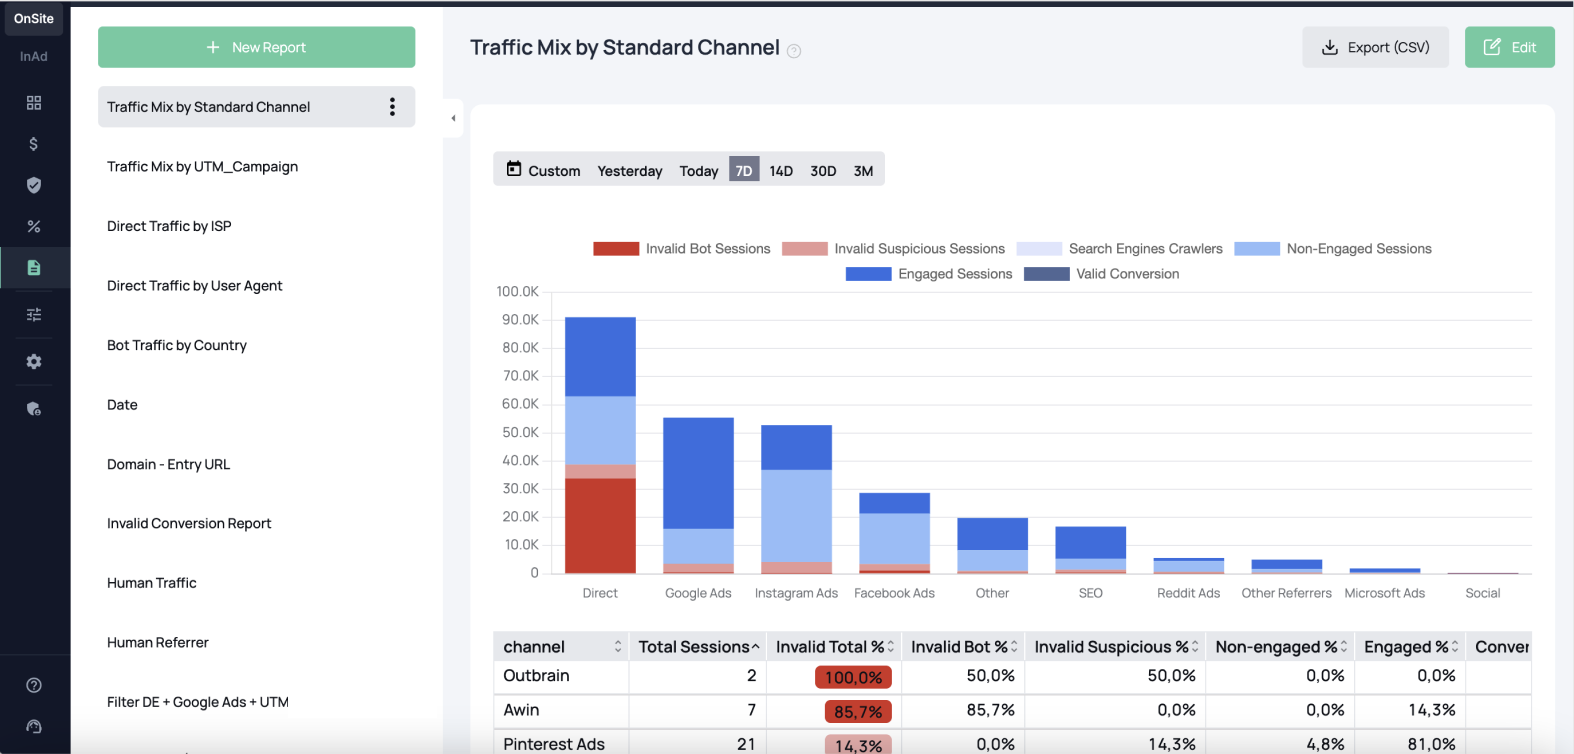
Depending on account setup, available report views may vary.
How we detect Invalid Traffic
To detect invalid traffic, we employ advanced algorithms and machine learning to analyze data discrepancies, behavioral anomalies, and traffic patterns. For more details, see our Onsite FAQs.
How we distinguish different Traffic Types across Marketing Channels
To differentiate traffic by validity and engagement, we employ advanced analytics and behavioral analysis, including:
🤖 Validity Assessment
🧠 Engagement Evaluation
Documentation for Reporting Data
The following data is available in the fraud0 on-site traffic reports. All of these fields are available on a session basis. Each field can be used for filtering, therefore restricting the traffic to a subset of the total data. These fields can also be used as a dimension, enabling a comparison between different traffic subsets.
Key Metrics
Metric | Definition |
|---|---|
Total Sessions | The total number of sessions measured within the selected time period. |
Invalid Sessions | The total number of sessions identified as invalid traffic within the selected time period including bot and suspicious traffic. |
Bot Sessions | The total number of sessions identified as bot traffic within the selected time period. |
Valid Sessions | The total number of sessions not identified as invalid (= human) traffic within the selected time period. |
Engaged Sessions | Valid sessions lasting over 10 seconds or with 2+ page views. |
Non-engaged Sessions | Valid sessions under 10 seconds and with fewer than 2 page views. |
Suspicious | Sessions with a bot score between 0–1, showing some bot-like behavior but not enough to confirm bot. |
Conversion | Valid sessions marked as converted by the fraud0 conversion tag. |
Invalid Suspicious Sessions | Sessions lacking a full bot scan or falling below the bot confirmation threshold – often accidental clicks or quick bounces. |
Invalid Bot Sessions | Sessions that underwent a full bot scan and triggered enough checks to be classified as bots. |
Next Steps
Ready to unleash the power of fraud0? Say hello to the world of Onsite!
Start here with everything you need to set up the Onsite Product and connect it seamlessly with your ad systems. Follow these simple steps to get up and running, ensuring your protection is in place from day one.
Getting Started
Set up Onsite and catch fraud on your website like a pro!
Connect fraud0 with your Ad Systems
Boost ad security and performance with fraud0 integration
Data Layer Events
Track bot and human traffic effortlessly with fraud0’s Data Layer Events
Set up your Webanalytics Tools
Learn how to set up your Webanalytics tools.
Have Questions? Our Onsite FAQ has answers
Explore our FAQ section dedicated to Onsite.
Need support?
Do you still have questions or require further details? Contact our support team for assistance!